
OSADL on realtime Linux determinism
![[plot]](https://static.lwn.net/images/2012/osadl-determinism.jpg) The Open Source Automation Development Lab has posted a press
release celebrating a full year's worth of testing of latencies on
several systems running the realtime preemption kernel. "
The Open Source Automation Development Lab has posted a press
release celebrating a full year's worth of testing of latencies on
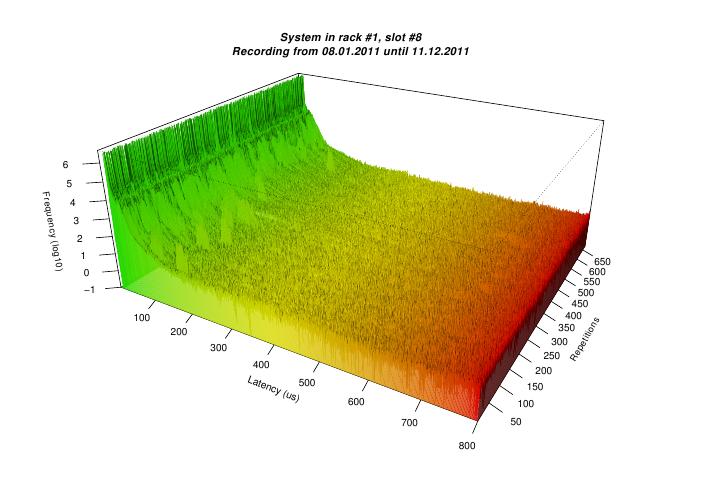
several systems running the realtime preemption kernel. "Each graph consists of more than 730 latency plots put before one another with the time scale running from back to front. A latency plot displays the number of samples within a given latency class (resolution 1 µs). The logarithmic frequency values at the y-scale ensure that even a single outlier would be displayed (for details of the test procedures and the load scenarios please refer to this description). The absence of any outlier in all the very different systems clearly demonstrates that the perfect determinism of the mainline Linux real-time kernel is a generic feature; it is not restricted to any particular architecture". OSADL is an industry consortium dedicated to encouraging the development and use of Linux in automated systems.
Posted Apr 3, 2012 15:30 UTC (Tue)
by dsommers (subscriber, #55274)
[Link] (2 responses)
Top left: x86 (AMD Athlon 64 bit 2800+)
Top right: ARM (TI OMAP3517 @496 MHz)
Middle left: MIPS (ICT Loongson-2 64 bit @533 MHz)
Middle right: ARM (i.MX35 @533 MHz, Phytec phyCORE-M)
Bottom left: x86 (Intel Atom N270 @1600 MHz)
Bottom right: x86 (VIA C7 @1000 MHz)
These are important details, to avoid comparing apples and oranges. And I wonder how the result would change on the 2.6.33 based tests if they were upgraded to 3.0.9-rt25 as well. Especially since most of the 2.6.33 based tests are around 100-150µs, while the 3.0.9 are around 50-75µs. Is this caused by hardware platform or is it distro related or kernel version related? I hope the latter one, but this test doesn't reveal that at all.
However, this does show that getting predictable latencies is possible in Linux with the PREEMPT RT patches - in general - no matter the hardware platform. It just doesn't say anything about the potential optimal performance between the hardware platforms.
Posted Apr 3, 2012 15:39 UTC (Tue)
by slashdot (guest, #22014)
[Link] (1 responses)
It would be nice to see Intel desktop CPUs and non-PREEMPT_RT kernels.
Posted Apr 7, 2012 11:31 UTC (Sat)
by cemde (subscriber, #51020)
[Link]
Posted Apr 3, 2012 17:06 UTC (Tue)
by jzbiciak (guest, #5246)
[Link] (15 responses)
On most of these CPUs, that'd be less than 2 minutes if they're measuring CPU cycles. That doesn't make any sense. Does anyone know the correct way to interpret that number?
Posted Apr 3, 2012 17:34 UTC (Tue)
by njs (subscriber, #40338)
[Link] (1 responses)
Posted Apr 3, 2012 17:49 UTC (Tue)
by jzbiciak (guest, #5246)
[Link]
Posted Apr 4, 2012 6:05 UTC (Wed)
by henrik (guest, #83948)
[Link] (12 responses)
Posted Apr 4, 2012 6:30 UTC (Wed)
by jzbiciak (guest, #5246)
[Link]
Posted Apr 4, 2012 6:33 UTC (Wed)
by pr1268 (guest, #24648)
[Link] (10 responses)
For those curious (myself included), that's more than 2300 wakeup cycles per second. That's a lot of waking up! ;-)
Posted Apr 4, 2012 6:58 UTC (Wed)
by jzbiciak (guest, #5246)
[Link] (9 responses)
Well, if I'm not misreading this output from vmstat 1, I have a similar interrupt rate on my quad Phenom box: I'm in the 2300 interrupts/sec category myself, and about 3000+ context switches. The interrupts seem evenly split between timer interrupts and "rescheduling" interrupts. I must admit ignorance: What are those? Here's what /proc/interrupts has to say: At any rate, the kernel config claims HZ=100. I wonder what's causing this spastic interrupt rate. Firefox maybe? With eleventy billion tabs open, it never gets down to a CPU usage of 0. It always has something going on. In any case, 2300 wakeups / second isn't too unusual, unless my box also is unusual. (I'm willing to grant that...)
Posted Apr 4, 2012 12:31 UTC (Wed)
by njs (subscriber, #40338)
[Link]
Posted Apr 4, 2012 14:59 UTC (Wed)
by cladisch (✭ supporter ✭, #50193)
[Link] (7 responses)
To find out where all the timer interrupts come from, enable timer usage statistics (see Documentation/timers/timer_stats.txt).
Posted Apr 6, 2012 7:35 UTC (Fri)
by jzbiciak (guest, #5246)
[Link] (6 responses)
I do have /proc/timer_stats, but it provides nothing interesting: Ah well. And yes, you are correct that I'm not in the habit of compiling kernel updates. I suspect I'd have to move to a more tinker-friendly distro to make that a reality. I have to admit, I got out of the habit of compiling my own kernels just a bit before it got popular for distros to wrap a bunch of magic up in the kernel build process--initrd and all these related toys. I think the last "customized" kernel I compiled and booted was an early 2.6 series kernel, pre 2.6.9. The stock distro kernel has been "good enough" for almost a decade, if not more. Perhaps I'm just being a wuss or maybe I just don't care enough, but the last time I tried compiling a custom kernel on one of my machines, I eventually ran away screaming. That was only after a day or two of fighting with it that I finally gave up and went back to a vender kernel. (The last two times I believe I tried this were on RedHat 8 or 9 (pre-Fedora) and Ubuntu. Something tells me if I tried this, say, on Slackware or even Debian, I would be telling a different story.)
Posted Apr 6, 2012 8:04 UTC (Fri)
by cladisch (✭ supporter ✭, #50193)
[Link] (5 responses)
So your kernel has the statistics gathering code.
Posted Apr 6, 2012 15:24 UTC (Fri)
by jzbiciak (guest, #5246)
[Link] (4 responses)
Well, all right then. Just before I started typing this reply, I echo'd a 1 into /proc/timer_stats to see what it might turn up. And what do we have here, 2 minutes later? Oy... plenty! Actually, the interrupt profile seems pretty diffuse. One standout is the gazillion evince processes I have running. I have a horrible habit of opening data sheets / documentation PDFs, and then leaving them open. strace -p <pid of random evince> ... Holy cats! That's a busy-looking poll loop that does.... nothing useful? The inotify file descriptor apparently has plenty to tell evince (about 3.3K worth each poll()), but why? Hmmm. Curiouser and curiouser. Now I'm off to go down this rabbit hole...
Posted Apr 6, 2012 15:54 UTC (Fri)
by jzbiciak (guest, #5246)
[Link]
Aha... Many of these PDFs live in /tmp. Evince watches the directory holding the PDF so that it can (for better or for worse) auto-refresh if the file its displaying gets replaced with an updated version. Instead, it just gets a bunch of update events for all of the "vteXXXX" files that are actually deleted(!) but still open for all of my umpteen gnome-terminal windows. Wow, is THAT a worthless use of resources!
Posted Apr 6, 2012 16:33 UTC (Fri)
by jzbiciak (guest, #5246)
[Link] (2 responses)
Hmmm... I can't even decide whose fault it is for all this. It looks like a little from column "A", a little from column "B" and a little from column "C": At least I can come out of the rabbit hole, even if I don't have a ready solution. :-P
Posted Apr 7, 2012 18:15 UTC (Sat)
by madscientist (subscriber, #16861)
[Link]
Posted Apr 10, 2012 20:47 UTC (Tue)
by zooko (guest, #2589)
[Link]
OSADL on realtime Linux determinism
Distro: Fedora 14
Kernel: 3.0.9-rt25 #1 PREEMPT RT Sun Nov 13 15:59:59 CET 2011 x86_64
Distro: Arago Project
Kernel: 2.6.33.7-rt29 #1 PREEMPT RT Mon Sep 27 09:54:08 CEST 2010 unknown
Distro: RAYS baihong 2.0 GNU/Linux
Kernel: 2.6.33.7.2-rt30 #5 PREEMPT RT Thu Jan 27 16:51:24 CET 2011 unknown
Distro: *** PHYTEC BSP PD10.2.1 based on OSELAS(R) ***
Kernel: 2.6.33.7.2-rt30 #1 PREEMPT RT Wed Mar 16 17:14:46 CET 2011 unknown
Distro: CentOS release 5.8 (Final)
Kernel: 2.6.33.14-rt31-atom #9 SMP PREEMPT RT Mon Jun 6 16:25:32 CEST 2011 i686
Distro: Fedora 10
Kernel: 2.6.33.14-rt31 #8 PREEMPT RT Mon Jun 6 13:44:29 CEST 2011 i686
OSADL on realtime Linux determinism
How does a latency plot of a non-RT system looks like?
Most recent single latency plot -> https://www.osadl.org/?id=869
Repeated latency plots -> https://www.osadl.org/fileadmin/media/r1s8-60.jpeg
OSADL on realtime Linux determinism
OSADL on realtime Linux determinism
OSADL on realtime Linux determinism
OSADL on realtime Linux determinism
"With two times 100 million wakeup cycles per day, a total of 73 billion cycles are recorded in a year's time."
OSADL on realtime Linux determinism
More than 2300 wakeup cycles per second
More than 2300 wakeup cycles per second
procs -----------memory---------- ---swap-- -----io---- -system-- ----cpu----
 r  b   swpd   free   buff  cache   si   so    bi    bo   in   cs us sy id wa
 1  0  32100 3506424 365440 2979380    0    0     1    10    1    0 11  2 87  0
 0  0  32100 3505704 365440 2979384    0    0     0     0 2543 3229  5  1 94  0
 1  0  32100 3504960 365440 2979388    0    0     0     0 2349 3042 15  2 83  0
 1  0  32100 3481244 365440 2979388    0    0     0   164 2201 2963 28  2 68  1
 0  0  32100 3517948 365440 2979388    0    0     0   144 2240 2933 14  2 84  0
$ cat /proc/interrupts
           CPU0       CPU1       CPU2       CPU3
  0:       3041     118260    9853911 1682455038   IO-APIC-edge      timer
  1:          0          0          0          2   IO-APIC-edge      i8042
  4:          0          0          0          4   IO-APIC-edge
  7:          1          0          0          0   IO-APIC-edge
  8:          0          0          0          1   IO-APIC-edge      rtc0
  9:          0          0          0          0   IO-APIC-fasteoi   acpi
 14:          0          0          0          0   IO-APIC-edge      pata_atiixp
 15:          0          0          0          0   IO-APIC-edge      pata_atiixp
 16:      44415      49328    7067183     155730   IO-APIC-fasteoi   hda_intel
 17:          0          0    1753147         24   IO-APIC-fasteoi   ehci_hcd:usb1, ehci_hcd:usb2, ehci_hcd:usb3, xhci_hcd:usb8, pata_jmicron, ahci
 18:       1613      39448     341649   22745885   IO-APIC-fasteoi   ohci_hcd:usb4, ohci_hcd:usb5, ohci_hcd:usb6, ohci_hcd:usb7, fglrx[0]@PCI:1:5:0
 19:          1          3          0         60   IO-APIC-fasteoi   hda_intel
 22:          0          0          0          2   IO-APIC-fasteoi   firewire_ohci
 44:  100096614          0          0         98   PCI-MSI-edge      eth0
 45:          0   37256958         58      30995   PCI-MSI-edge      ahci
NMI:          0          0          0          0   Non-maskable interrupts
LOC: 2068147993 2377844402 1668359324  239470048   Local timer interrupts
SPU:          0          0          0          0   Spurious interrupts
PMI:          0          0          0          0   Performance monitoring interrupts
PND:          0          0          0          0   Performance pending work
RES: 2555648191 2131761062  860328033  353027675   Rescheduling interrupts
CAL:       6867       5608       6269       8570   Function call interrupts
TLB:   24121576   19609582   18233777   16129012   TLB shootdowns
TRM:          0          0          0          0   Thermal event interrupts
THR:          0          0          0          0   Threshold APIC interrupts
MCE:          0          0          0          0   Machine check exceptions
MCP:      29480      29480      29480      29480   Machine check polls
ERR:          1
MIS:          0
More than 2300 wakeup cycles per second
More than 2300 wakeup cycles per second
If you don't have /proc/timer_stats, you have to enable CONFIG_TIMER_STATS, but given your kernel version, you're probably not in the habit of recompiling it.
More than 2300 wakeup cycles per second
$ cat /proc/timer_stats
Timer Stats Version: v0.2
Sample period: 0.000 s
0 total events
More than 2300 wakeup cycles per second
I do have /proc/timer_stats
but it provides nothing interesting
More than 2300 wakeup cycles per second
More than 2300 wakeup cycles per second
More than 2300 wakeup cycles per second
More than 2300 wakeup cycles per second
More than 2300 wakeup cycles per second